Electoral Colleges all the way down
In which I answer a question posed on Twitter
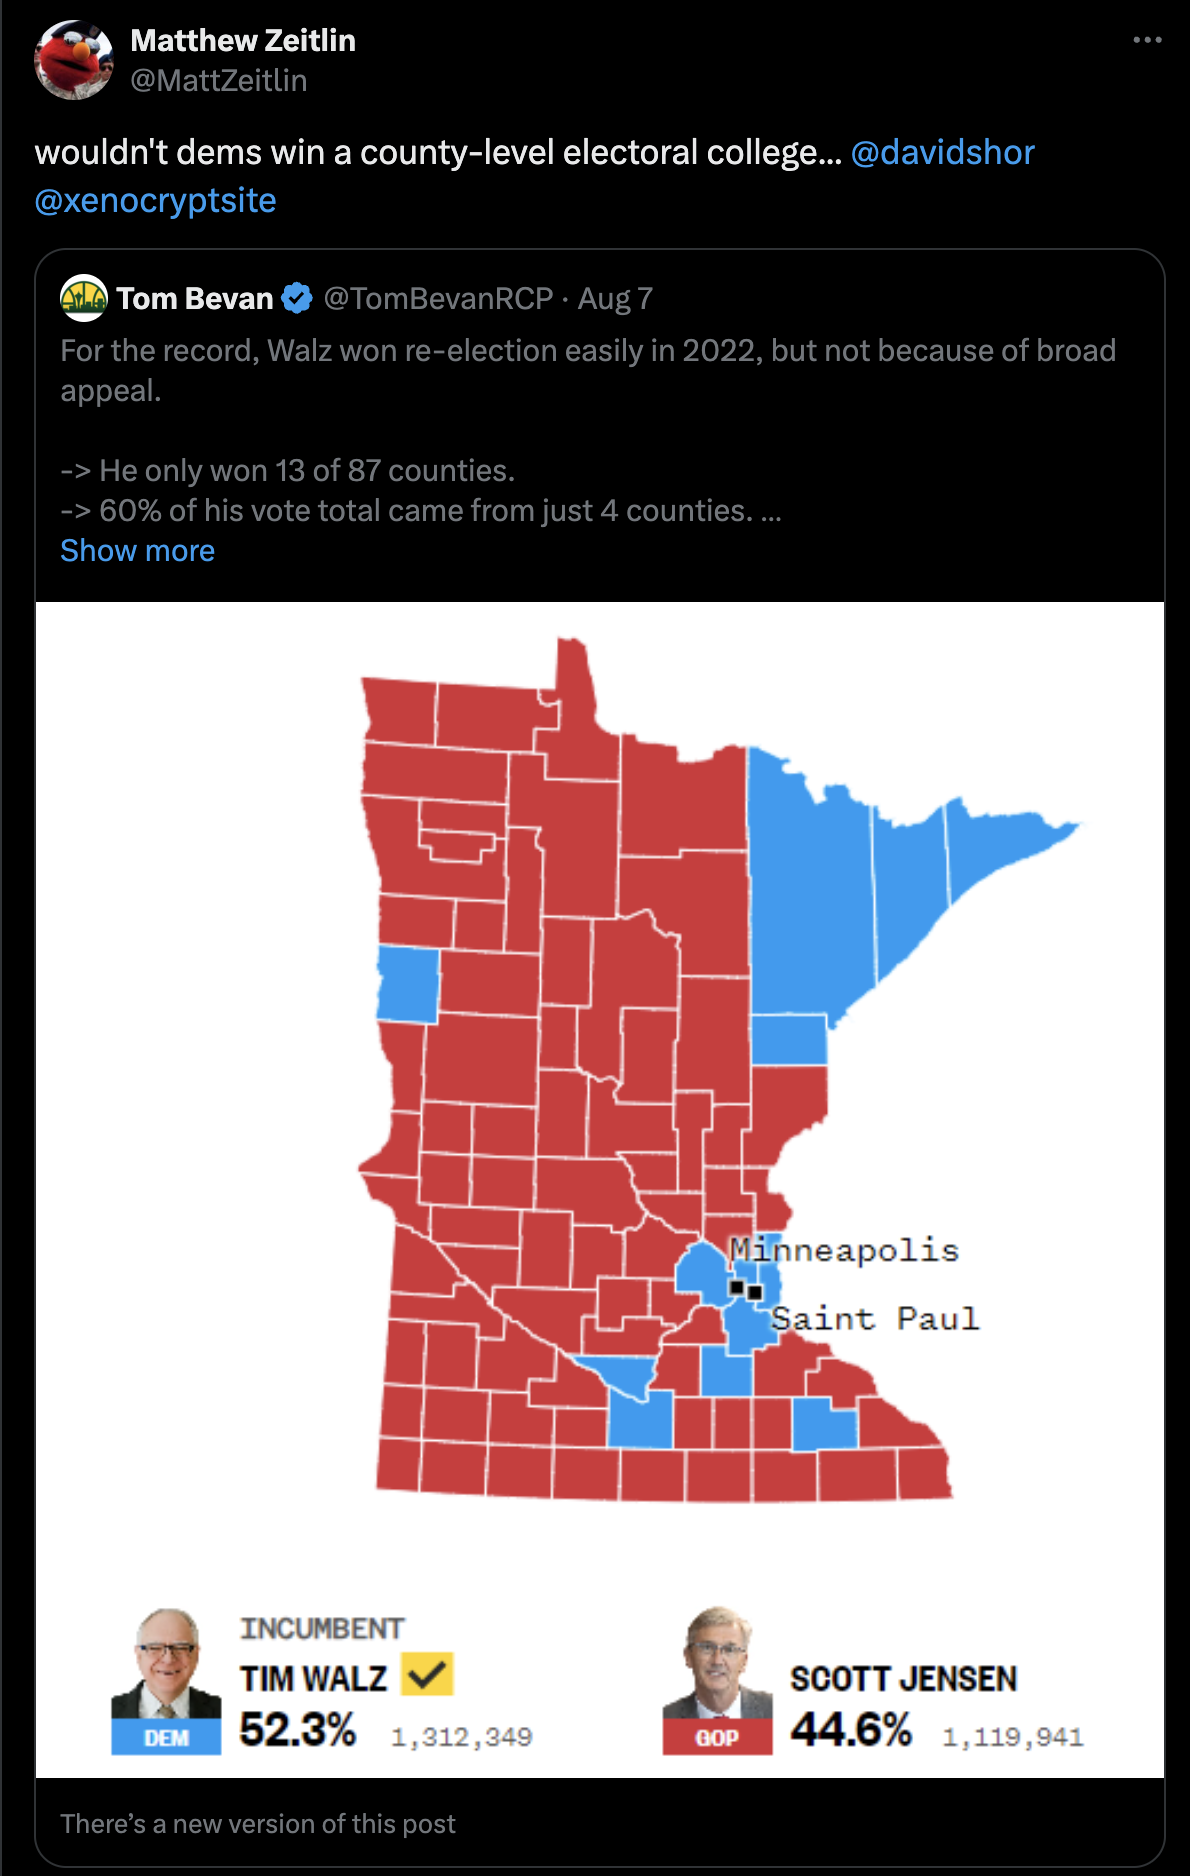
It’s election season so there are always interesting questions flying around. Needless to say it’s the season for nerdsniping and so nerdsniped I was. The link to the original tweet is here, but you may as well see a screenshot:

Using data from 2020 county level returns sourced from this Github Repo and county level population for 2020 from the census we can roughly model what an electoral college would look like for each state. I only use presidential election results for this so if there was a significant divergence between those results and gubernatorial election results then this model won’t apply but it’s still fun to play around with.
As to the answer, basically, it depends. The regular electoral college has two votes for each state on top of their population weighted electoral votes determined by the census. If we assume that there will be a similar two senators per county then the GOP would have won, if we assume that there wouldn’t be because there aren’t so many senators in the Minnesota state senate then yes the Democratic party would win with this system. But that just goes to show the low population/rural advantage that senate apportioned systems give to the GOP with its current voter base.
Below you can find the interactive version that I made, by default a senate style apportioning is assumed but feel free to play around with it. I haven’t checked quite yet, but I think this makes the national map much more strongly GOP.
You may have to wait a couple of seconds for the app to fully load in, but give it a try, most of the US is covered.